Features
A detailed look at everything DataTruth can do — for users, teams, and organisations.
Table of Contents
- Natural Language Queries
- Typo-Tolerant Fuzzy Search
- Auto-Generated Charts & Visualisations
- Real-Time Chat Interface
- Role-Based Data Insights
- Data Quality Monitoring
- Schema Explorer with AI Descriptions
- Semantic Layer
- User Management & Administration
- Database Connection Management
- Security & Access Control
- Intelligent Suggestions & Learning
Natural Language Queries
The core of DataTruth: ask questions the way you’d speak them, and get accurate answers instantly.
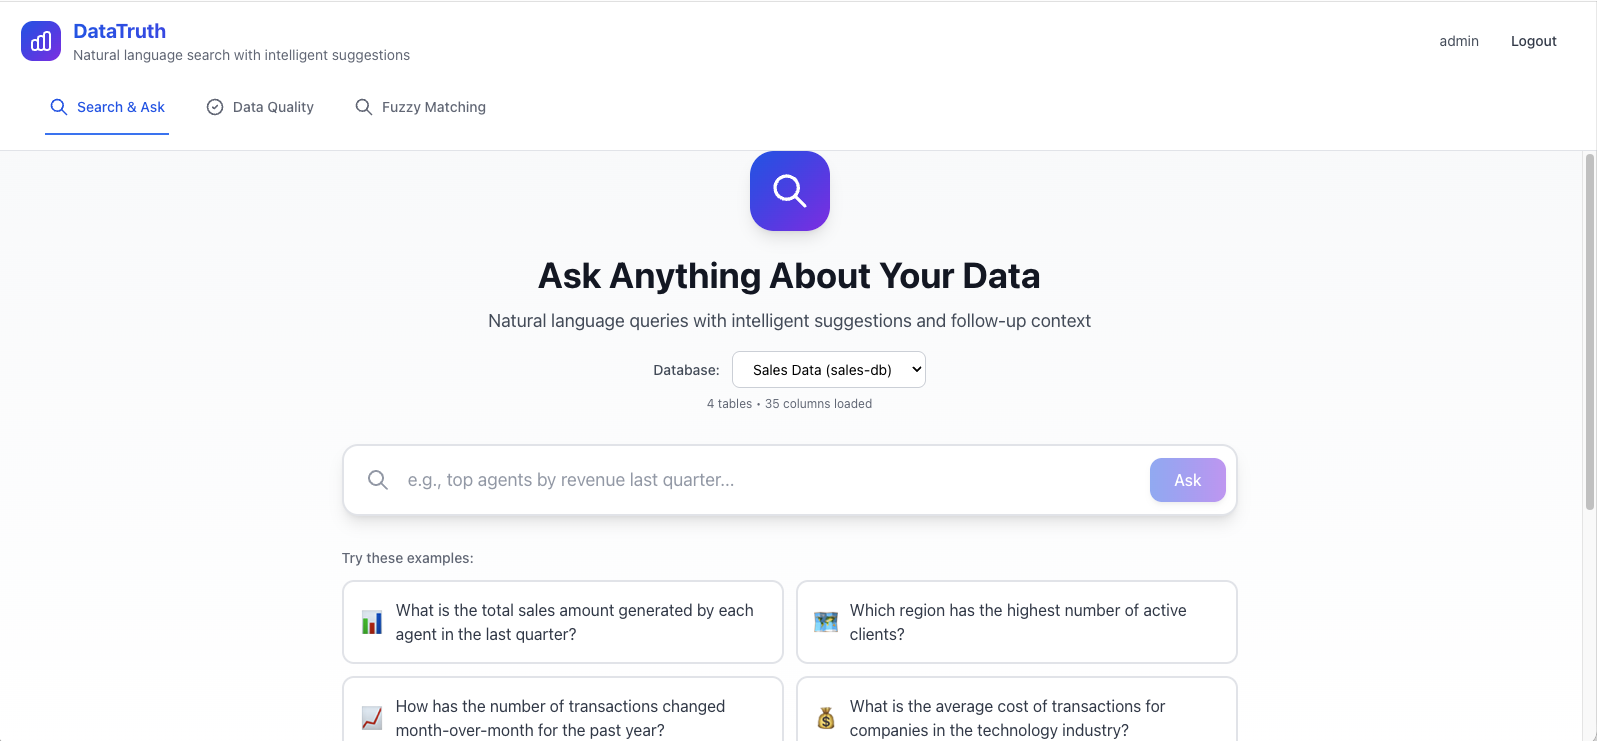
You type a question. DataTruth:
- Interprets your intent using GPT-4
- Translates it into a safe, validated SQL query
- Runs it against your database (read-only)
- Returns results with an automatically chosen chart
Example questions DataTruth understands:
- “Show me the top 10 customers by revenue last quarter”
- “Which products had the lowest margins this year?”
- “Compare average order value by region for the past 6 months”
- “List all customers who haven’t placed an order in 90 days”
- “What’s the total sales for each salesperson this month?”
Typo-Tolerant Fuzzy Search
DataTruth doesn’t require perfect spelling or exact field names. Its fuzzy matching engine understands intent even when input is approximate.
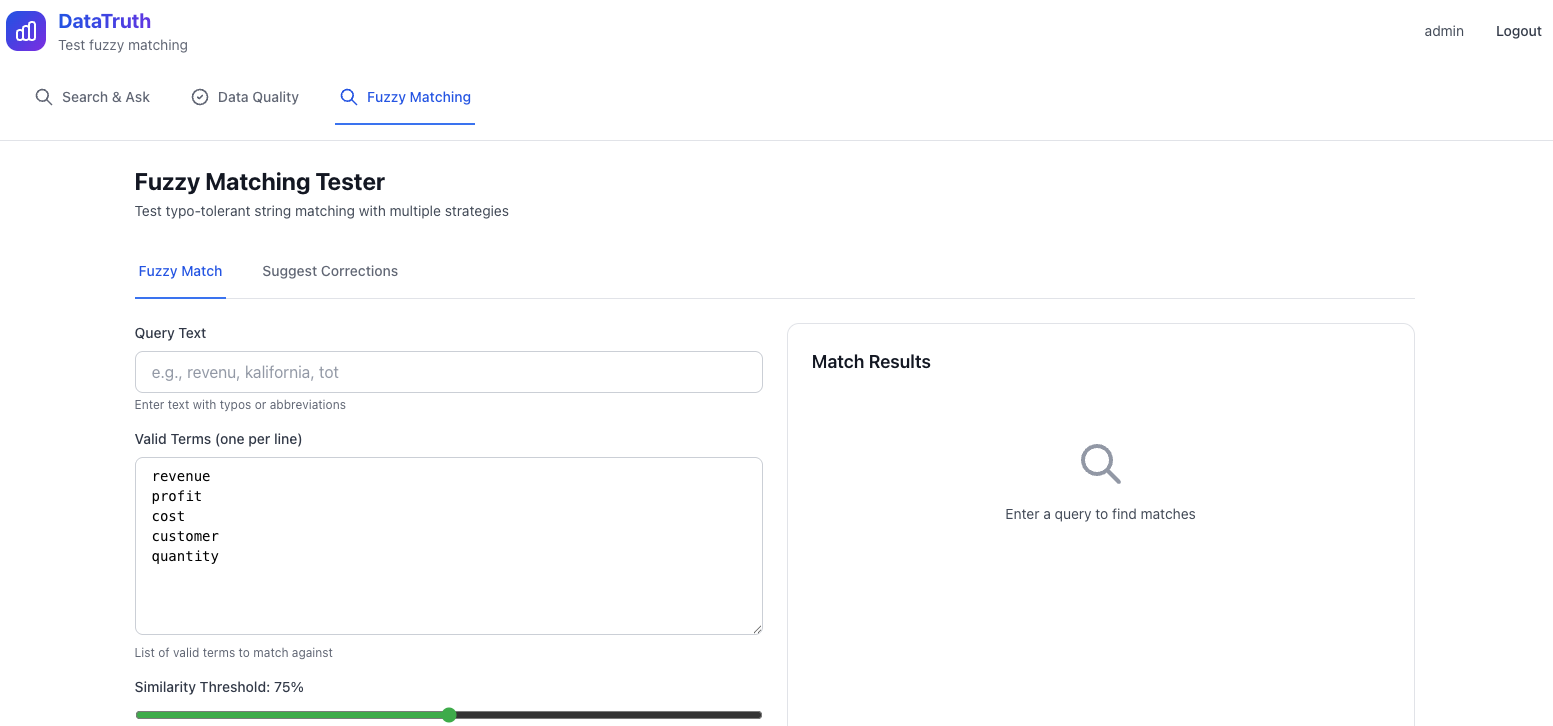
"revenu"→ finds revenue fields"califrnia"→ matches California"tot sal"→ resolves to total sales"cstmr"→ finds customer-related data
This makes the system genuinely usable for everyone — not just people who know the exact database column names.
Auto-Generated Charts & Visualisations
Every query response includes an automatically generated visualisation — DataTruth selects the chart type best suited to your data.
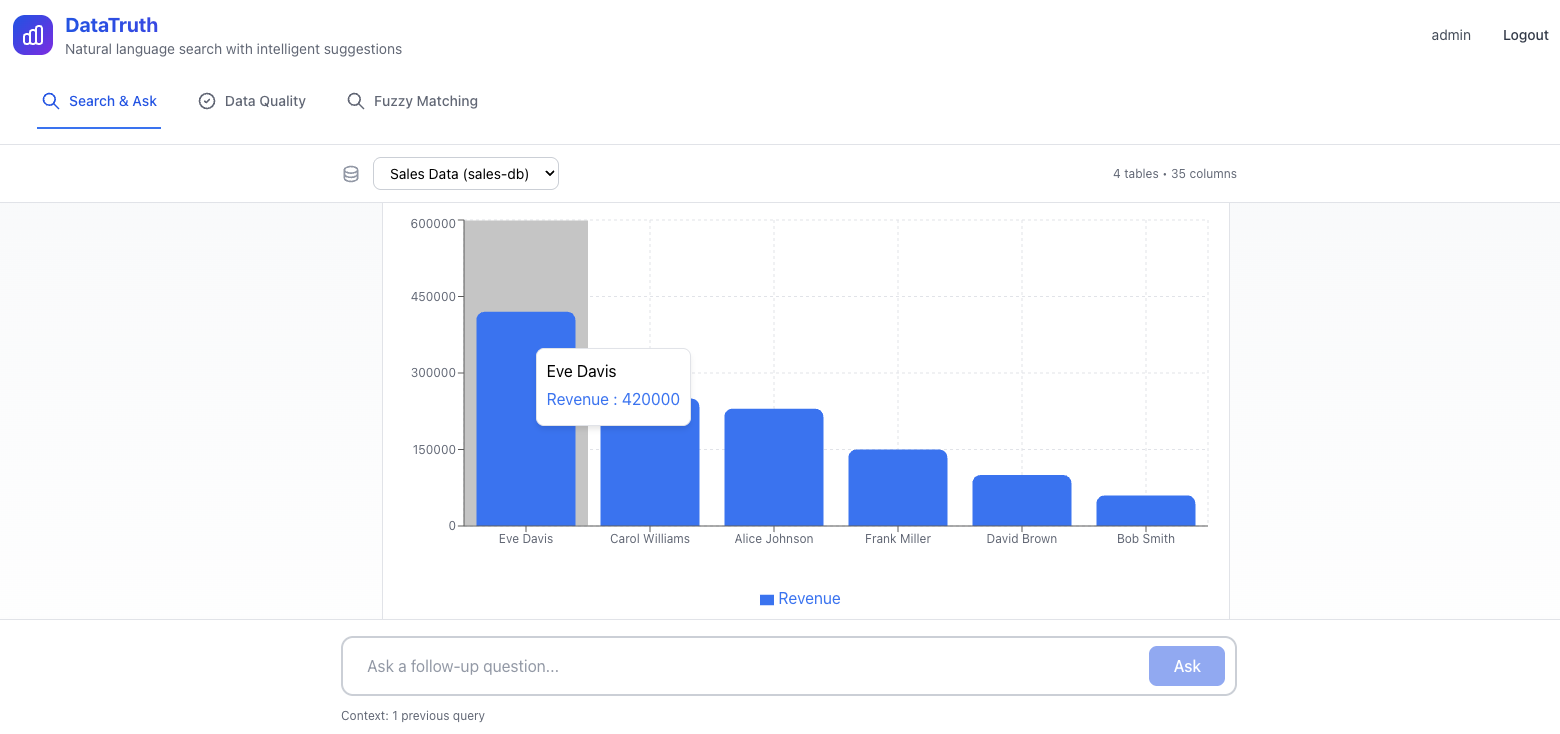
Supported chart types:
- Bar charts (comparisons)
- Line charts (trends over time)
- Pie / donut charts (proportions)
- Area charts (cumulative trends)
- Scatter plots (correlations)
- Data tables (raw results)
Charts are interactive — hover for values, click to drill down, and export to PNG or PDF.
Real-Time Chat Interface
DataTruth uses a conversational chat interface, making it feel like talking to a knowledgeable data analyst.
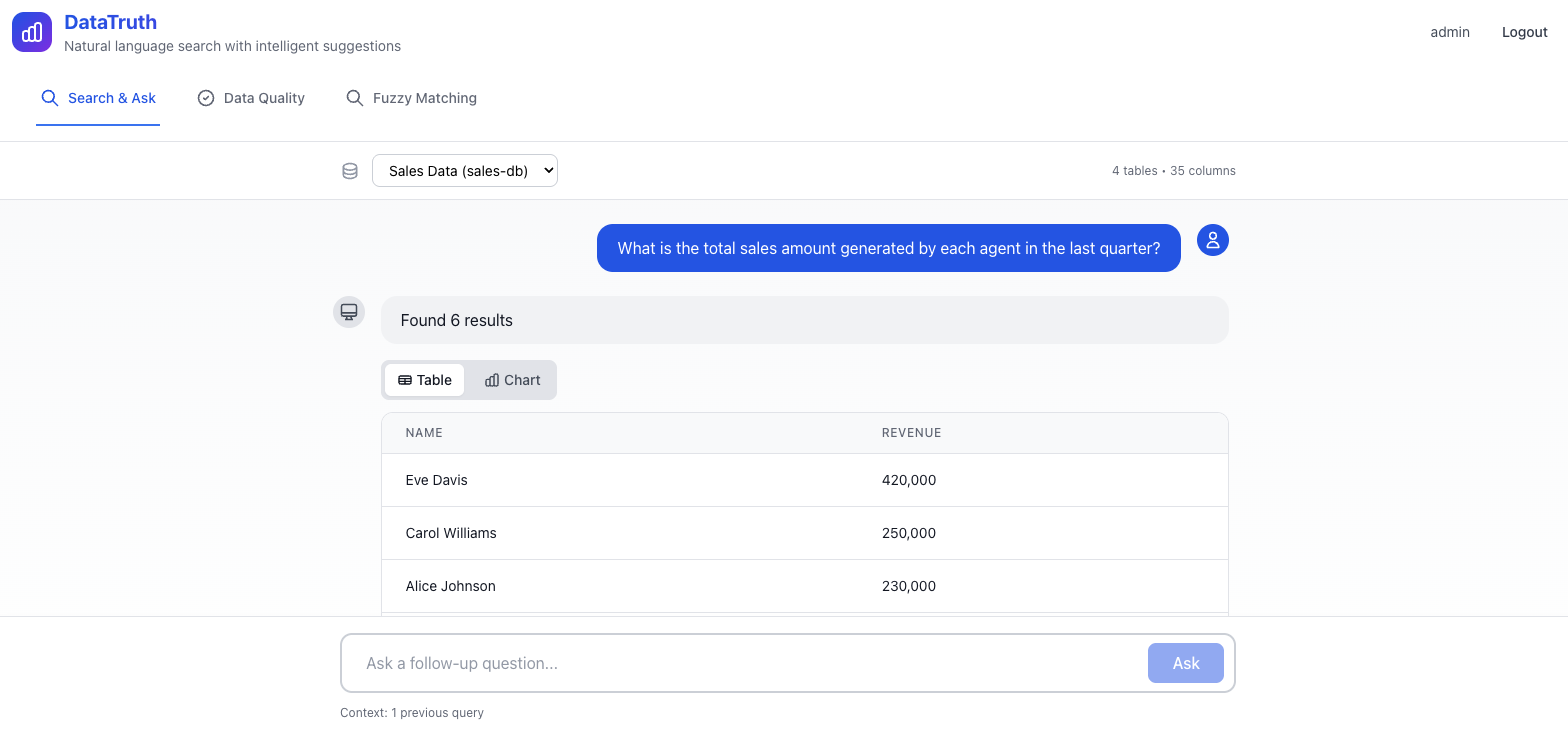
Chat features:
- Multi-turn conversations — ask follow-up questions
- Query history — revisit past questions
- Suggested examples — AI-generated prompts tailored to your data
- Export results — download data as CSV, Excel, or PDF
- Share — copy a link to results with your team
Role-Based Data Insights
DataTruth tailors the experience to each user’s role — everyone sees what’s relevant to them.
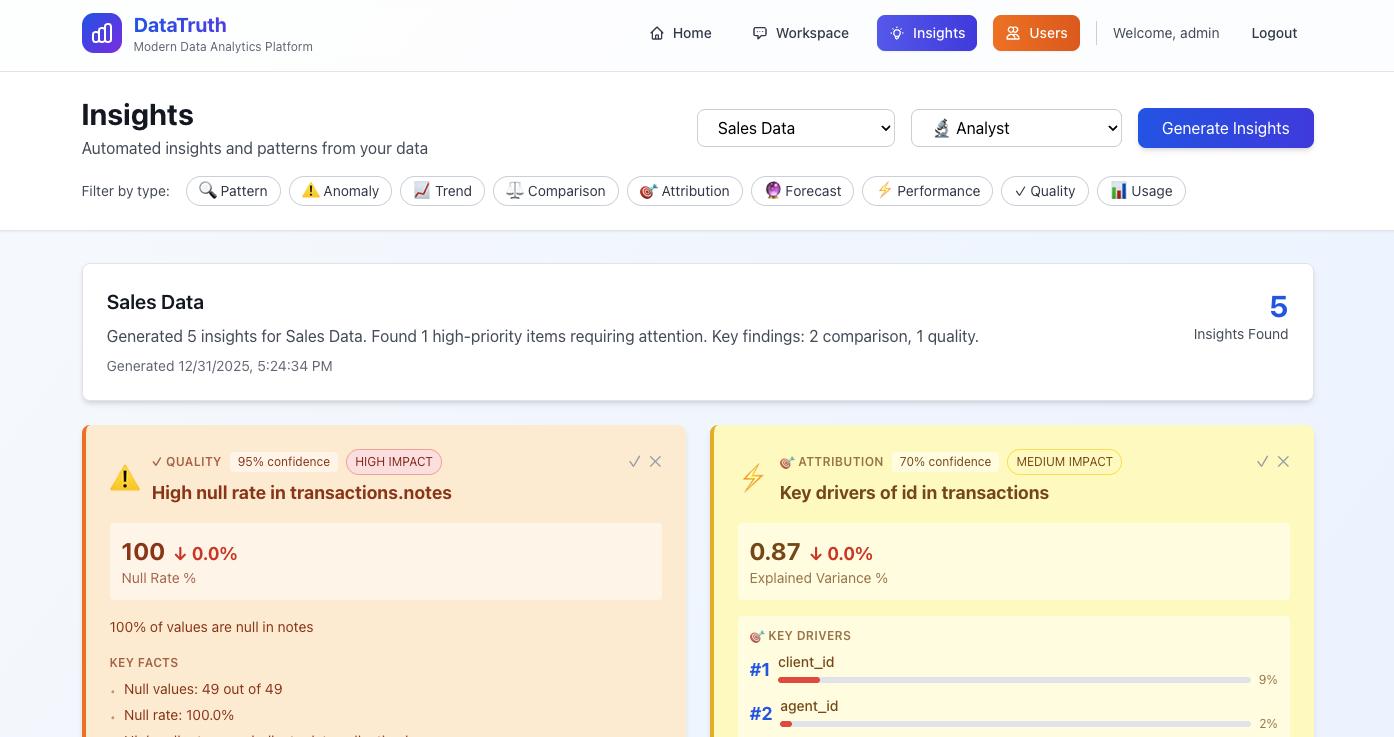
| Role | Default Insights |
|---|---|
| Executive | Revenue trends, KPI summaries, top-line metrics |
| Analyst | Deep-dive analytics, custom queries, metric builder |
| Developer | Schema explorer, query performance, API usage |
| Admin | User activity, system health, connection status |
Admins can customise which datasets each role can access, ensuring sensitive data stays protected.
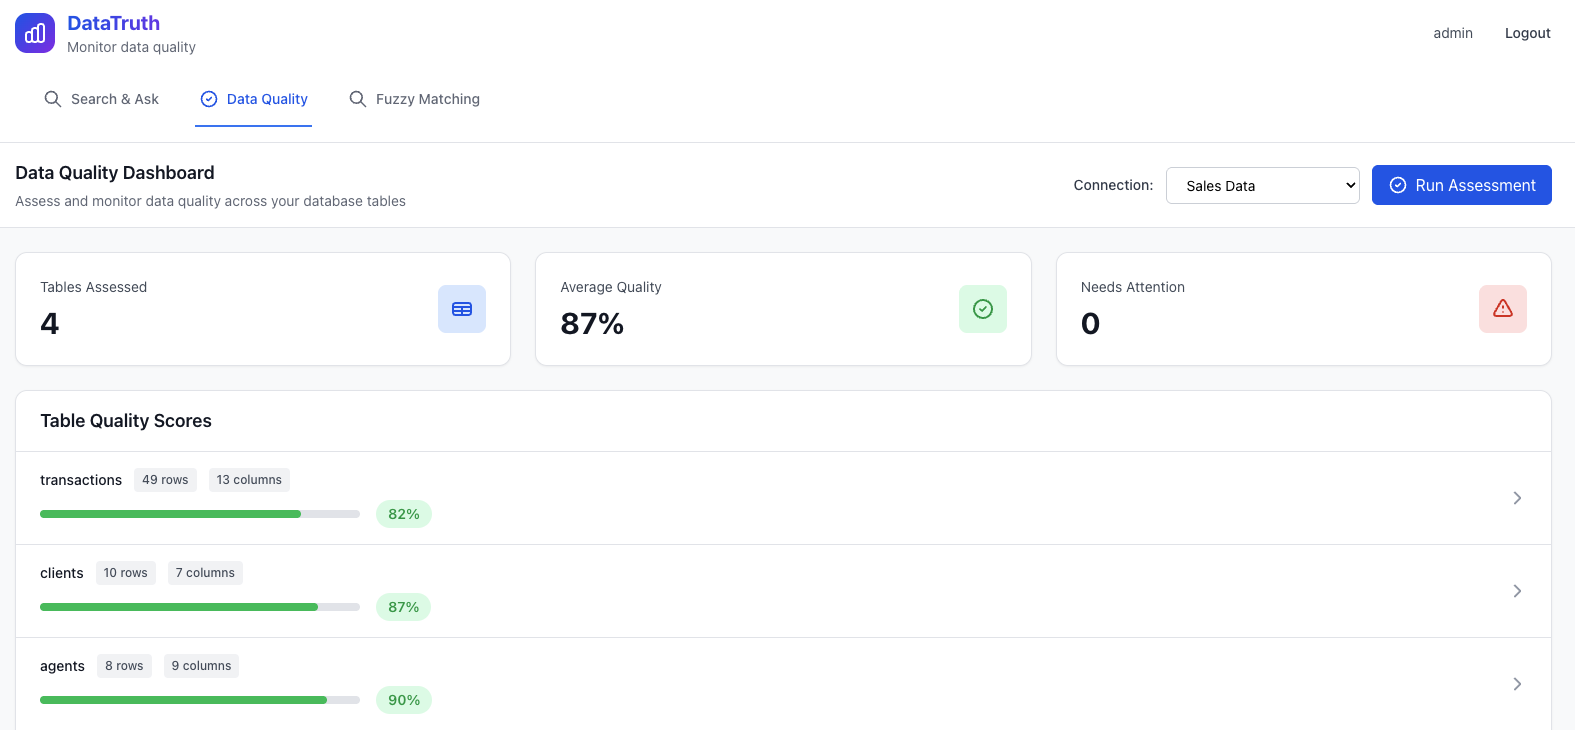
Data Quality Monitoring
DataTruth continuously monitors the quality of your connected data across 6 dimensions.
| Dimension | What It Checks |
|---|---|
| Freshness | How recent is the data? When was it last updated? |
| Completeness | Are there missing or null values? |
| Accuracy | Do values fall within expected ranges? |
| Consistency | Are values uniform across related records? |
| Validity | Do values follow defined business rules? |
| Uniqueness | Are there duplicate records? |
Each dimension gets a score. Alerts are raised automatically when quality drops below thresholds — before bad data causes bad decisions.
Schema Explorer with AI Descriptions
Understanding a database schema can be daunting. DataTruth makes it approachable by generating plain-English descriptions for every table and column using AI.
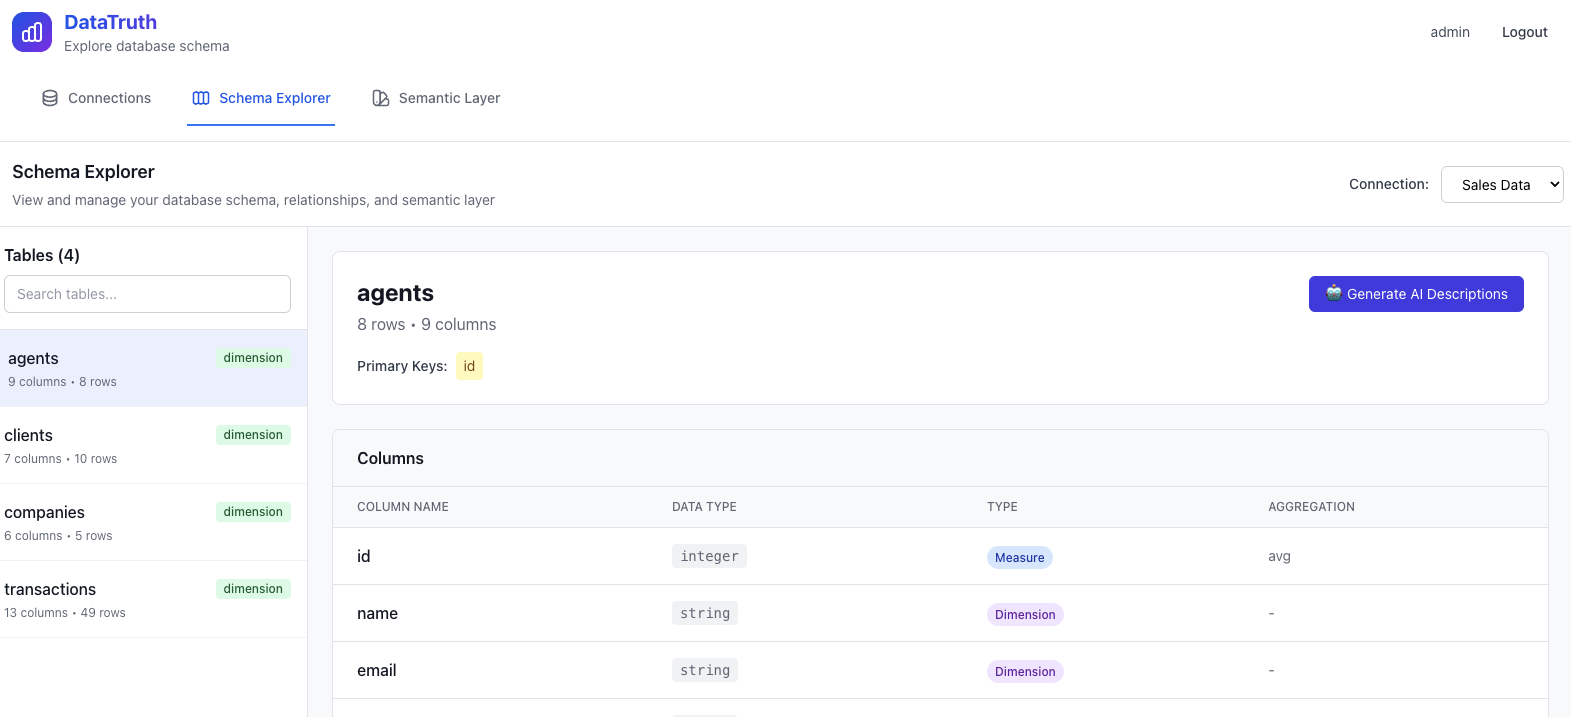
- Browse all tables and columns in your connected database
- See AI-generated descriptions of what each field contains
- Understand relationships between tables
- Use descriptions to guide better natural language queries
Semantic Layer
Define your business metrics and terminology once — and make them available to everyone who uses DataTruth.
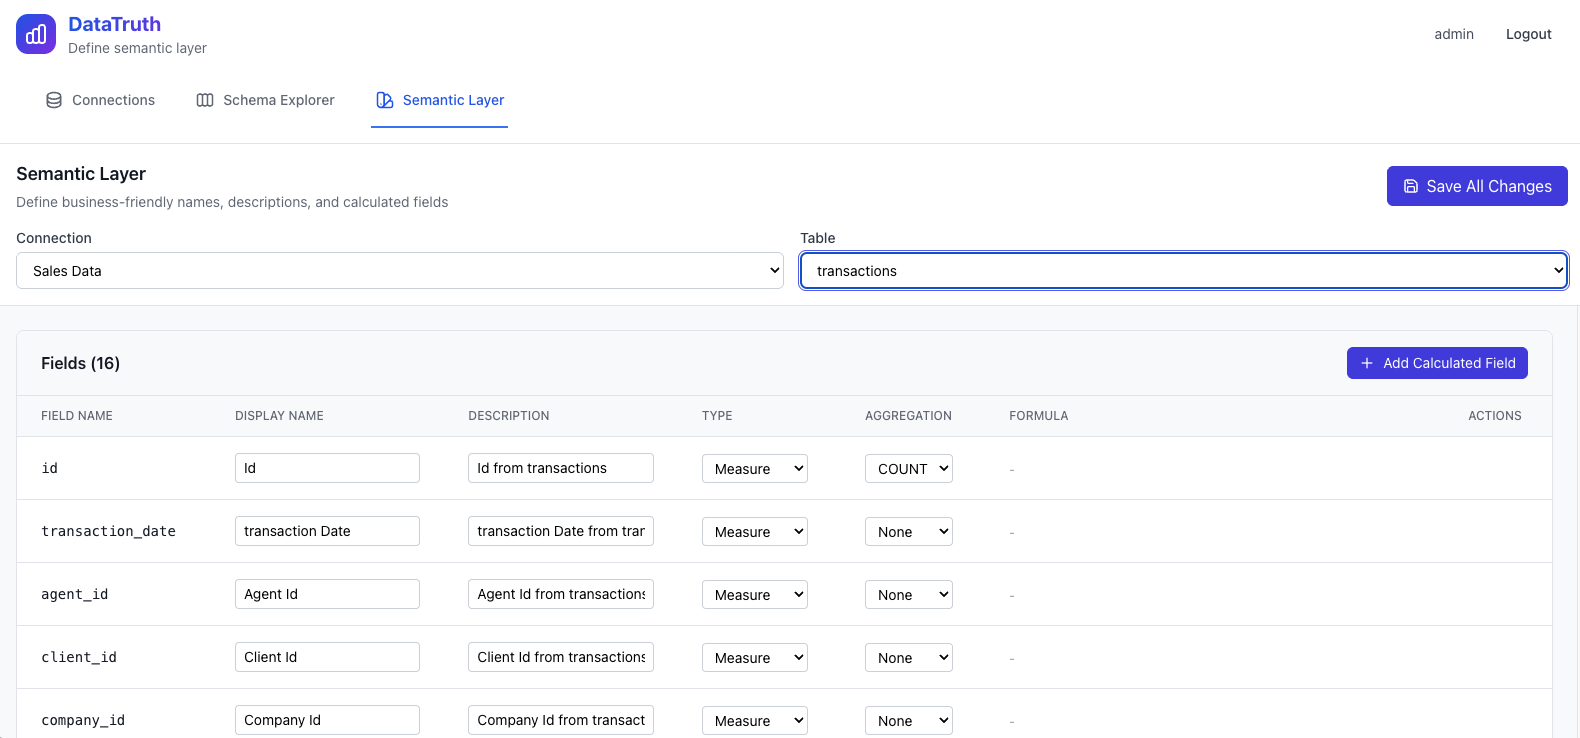
The semantic layer bridges the gap between raw database columns and meaningful business concepts:
- Calculated Metrics — define formulas (e.g. “Profit Margin = (Revenue - Cost) / Revenue × 100”)
- Business-Friendly Names — map technical column names to clear labels (e.g.
cust_acq_dt→ “Customer Since”) - KPI Definitions — set targets and thresholds for key metrics
- Cross-Database Mapping — unified field names across multiple connected databases
Once defined in the semantic layer, metrics are automatically used by the AI when answering relevant questions.
User Management & Administration
A complete admin panel for managing users, roles, connections, and system settings.
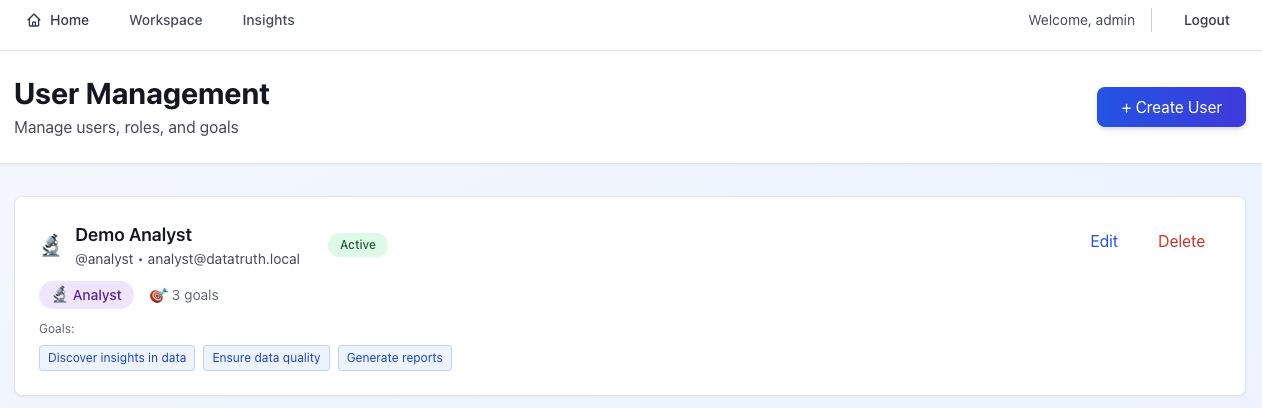
User management features:
- Create, edit, and deactivate user accounts
- Assign and change roles (Admin, Analyst, Executive, Developer)
- View per-user query history and activity
- Bulk operations for large teams
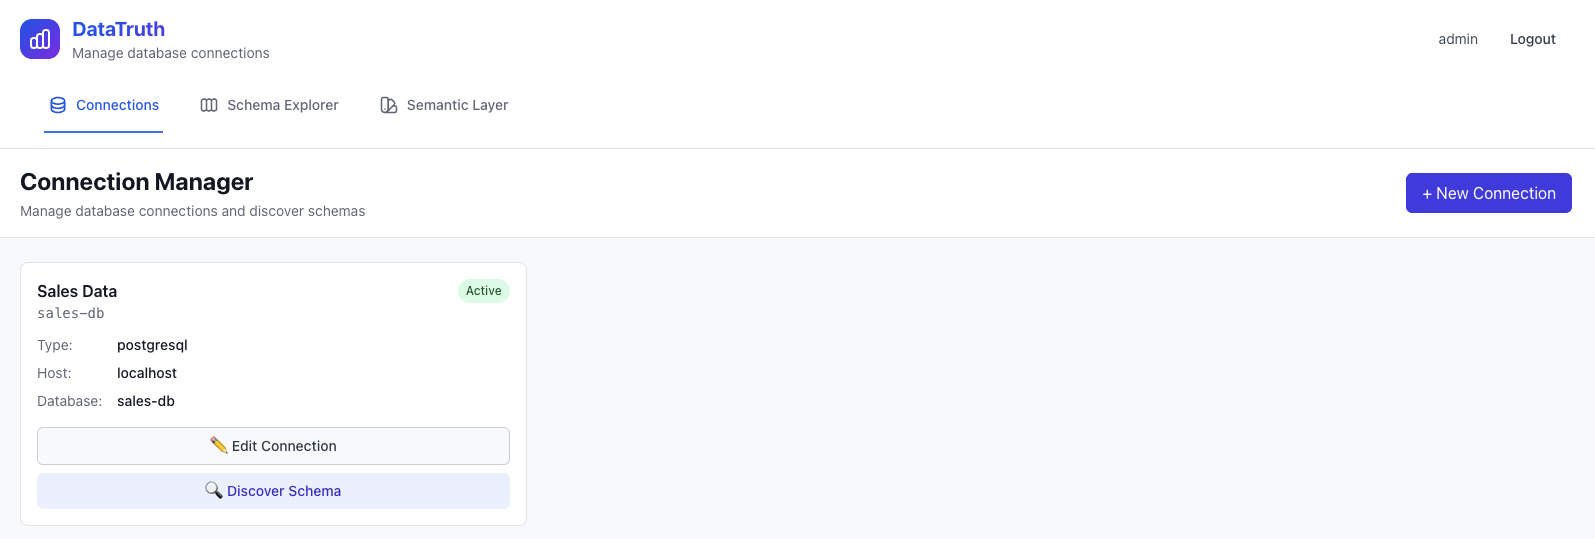
Database Connection Management
Connect DataTruth to any number of databases through a point-and-click interface.
Supported databases:
- PostgreSQL
- MySQL
- Snowflake
- BigQuery
Features:
- Test connection before saving
- Auto schema discovery on connect
- Secure encrypted credential storage
- Read-only access enforced at the connection level
Security & Access Control
DataTruth is designed from the ground up with enterprise security in mind.
- Read-only connections — DataTruth can never write to, modify, or delete your data
- SQL validation — all AI-generated queries are validated and sandboxed before execution
- JWT authentication — secure session management
- Role-based access — users only see data their role permits
- Complete audit trail — every query, login, and admin action is logged
- Encryption — credentials encrypted at rest; all traffic over HTTPS
Intelligent Suggestions & Learning
DataTruth gets better the more you use it:
- Suggested queries — the AI generates example questions tailored to your actual data schema
- Learning from feedback — thumbs-up/down on answers trains the system over time
- Terminology learning — business-specific terms and abbreviations are remembered and reused
- Query pattern recognition — frequently asked questions are optimised for faster response